
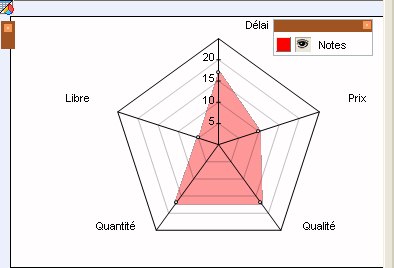
Radar Graphic
This type of graph has as many axes as data categories; this data are linked through segments that form a graph shaped like a spiderweb.
This way, various data are highlightened and compared to one another, each series of values being represented by different colors.
For instance:
The data represented on the graph can be displayed in a grid.
The passage from graphic mode to grid mode can be made by clicking on the following icon: in client server mode client, or
  in web mode. This icon can be found in the upper left corner of the graph. An example and additional information on the common characteristic between graphic representations can be found in the general document Graphic representations.
The tool box
A tool box, displayed as closed by default, can always be found in the following graph:  .
.
After opening, it is displayed as follows: 
The buttons it contains are used to adjust the graphic display on screen:
 : zoom in
 : zoom out
 : back to normal display
 : moving the graph. This is very useful after zooming in since the size of the graph is superior to the screen display area.
 : back to initial display before the move
This box can be moved.
When closing it, it takes its initial location on the left side of the graphic.