
Graphic representations
The X3 Sage softwares integrate new graphic components from the version 5 on.
Some of these components are designed with Flash and others with DHTML.
They make it possible to provide different graphic representation modes that fit the data to view. These can be:
- graphics of type bar, line chart...illustrating the figures displayed in grids,
- graphics of type Radar,
- graphics of type Gantt diagram, used mainly for managing the manufacturing tracking,
- graphic representations of agendas, used namely in CRM and Customer support.
This documentation describes the various common characteristics and lists the different presentation modes possible.
Common characteristics
Graphic/Grid mode
The graphic data are mainly displayed in a grid present alternately where the graphic representation is located.
If the grid and the graphic are displayed alternately, switching from one to the other is made by clicking on following icon in server client mode, or
 in Web mode. This icon is located on the upper left side of the graphic.
Example:
Full screen mode
The screen section in which the graphic is displayed can be enlarged if needed.
This functionality is activated:
- In server client mode: by clicking on the icon .
.
- In Web mode, by clicking on the upper right side of the section.
The section is then enlarged to a maximum and takes all the available space. The left list and the bottom screen buttons are not to be seen anymore.
In server client mode, it is also possible to enlarge the section but at the same time to display the left list and the bottom screen buttons. To achieve this, click on the icon while pressing the
In order to scale down the section up to its original size, click on the icon  in server client mode, or again on the upper right corner of the section in Web mode.
Grids
Two types of graphic representations of grids are available:
- The single-set representations.
For instance:
In this type of graphic, only one column of the grid is illustrated.
- The multi-set representations.
For instance:
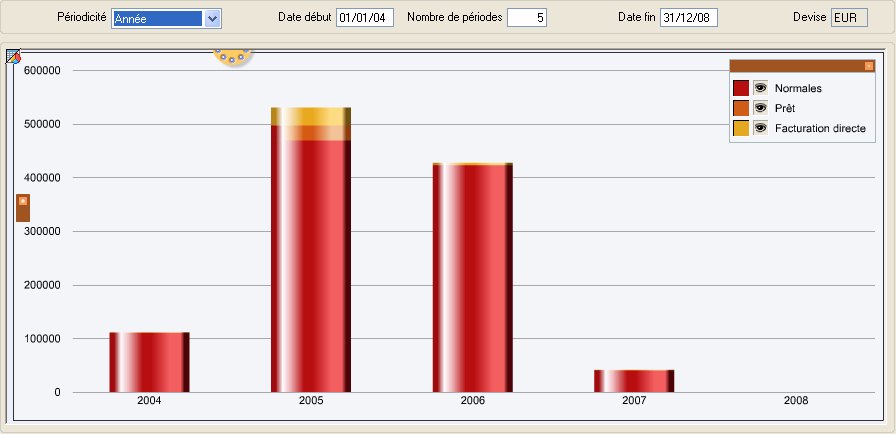
In this type of graphic, several columns of the grid are illustrated. They can be compared or added.
In most cases, the representation mode display can be modified by the user.
For further details on the dynamic use conditions of grids, refer to document Graphic representation of grids.
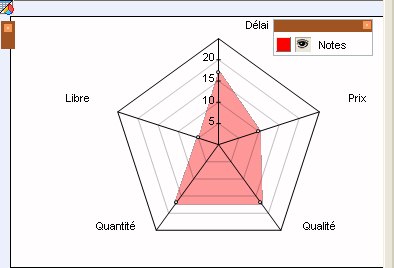
Radar graphic
In this type of graphic, the serial data are linked through segments, thus forming a spider web.
It is mainly used for notation purposes at the Supplier tracking level.
For instance:
For further details on this graphic, refer to document Radar graphic.
Gantt diagram
This diagram is used mainly in manufacturing management in order to provide a graphic representation of the task scheduling and tracking.
For instance:

For further details on this graphic dynamic display conditions, refer to document Gantt diagram.
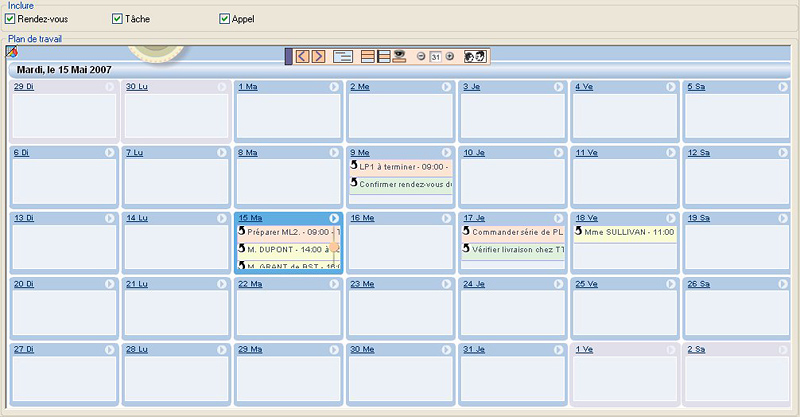
Calendar
The calendar is used as a traditional calendar to manage events like meetings, tasks and CRM calls or Customer support interventions.
For instance:
For further details on this calendar dynamic display conditions, refer to document Graphic representation of the calendar.