
Graphic representation of grids
If at least one of the columns in a grid is numeric, it is possible to present the values of that column in a graph.
This presentation is widely used in the inquiry screens.
Whether the presentation is displayed or not can be set up; it can be displayed along with the table (on the right, on the left, above, under), or in the same place as the table, alternately.
In the case where the grid and the graph appear alternately, switching from one mode to the other is carried out by clicking on the following icon:  in client server mode, or
  in web mode. It is located on the upper left corner of the grid.
An example and additional information on the common characteristics between graphical representations can be found in the general document Graphical representations.
Two graphical representation types exist:
- The single-set representations
- The multi-set representations
Prerequisites
If you use the Mozilla browser, the Flash Player plugin will need to be installed to correctly display the graphical form of the calendar. This plugin is available at the following address:
http://get.adobe.com/fr/flashplayer/
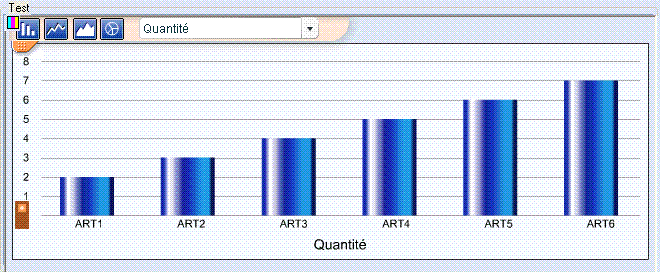
The single-set presentations
This type of graph is used when only one data set is represented.
These data correspond to the values of only one of the grid columns.
How to modify this representation mode?
Upon displaying the graph, the button bar displayed above the graph is used to choose the representation mode and to select in the drop-down list the column of the grid to be represented.
For example :
How to select the set to display?
The set must be selected in the drop-down list:
Noteall the numeric columns of the grid are not necessarily available in this drop-down list. Only those whose graphical display is of interest are available.
The multi-set presentations
This type of graph is used when several sets of data are presented at the same time.
They are used to compare or add up the values of several columns in the grid.
How to modify this representation mode?
In some cases, the representation is mandatory and may combine several different modes.
For example :
In most case, a representation is proposed.
However, there is still the possibility to choose another representation mode.
For that purpose, a choice range is made available. Upon screen opening, this choice range is displayed in the form of an icon at the top of the graphic. Clicking on this icon displays the range.
Once open, its rotational motion can be stopped by clicking on it in order to choose the representation mode. It is automatically closed as soon as the cursor is set in the area where the graph is displayed.What are the available representation modes?
- Comparison bars, lines or areas (in values)
- Comparison bars, lines or areas (in percentages)
- Cumulation bars, lines or areas
- comparison sectors.
How to select the data to display?
The list of represented data is present in the graph caption.
This list may be moved and/or closed.
Selecting/unselecting the data to be displayed is done as follows:
Note :
Depending on the selected mode and the chosen values to display, the graph scale is automatically adjusted to the display area.
Selection on graphs of type Comparison sectors :
The tool box
Regardless of the graph type -single-set or multi-set -, a tool box is displayed which is closed by default and is available on the graph at all times: 
After opening, it is displayed as follows: 
The buttons it contains are used to adjust the graphic display on screen:
 : zoom in
 : zoom out
 : back to normal display
 : moving the graph. This is very useful after zooming in since the size of the graph is superior to the screen display area.
 : back to initial display before the move
This box can be moved.
When closing it, it takes its initial location on the left side of the graphic.